 I’ve long been bugged by the inequities of our CIF Division and league systems. The Southern Section has tried to solve this in ball sports with the competitive equity approach, but for me, that only rewards mediocrity and punishes success. And the process of league classification, while accounting for geography and school size, seems driven largely by schools’ relative success in football and basketball.
Schools of the same size can face very different demographic realities. Coaching for success is hard in every situation, but it’s certain that kids who are recent immigrants and students from families facing economic hardship are much less likely to participate in sports than those who do not. No one can coach kids they never see.
What follows is a new system of classification that adjusts school enrollment numbers downward in relation to two readily available school statistics: the percentage of English Language Learners and the Percentage of students who qualify for Free or Reduced Lunch (Economically Disadvantaged). This system also tries to account for the different circumstances of private schools. You can read about this in greater detail after the jump
I’ve also divided the schools of the San Gabriel Valley into three divisions for cross country, and two for track & field, enabling us to make like to like comparisons, and to honor teams that have done well in the actual circumstances they face.
You can view the divisions and the data in this spread sheet.
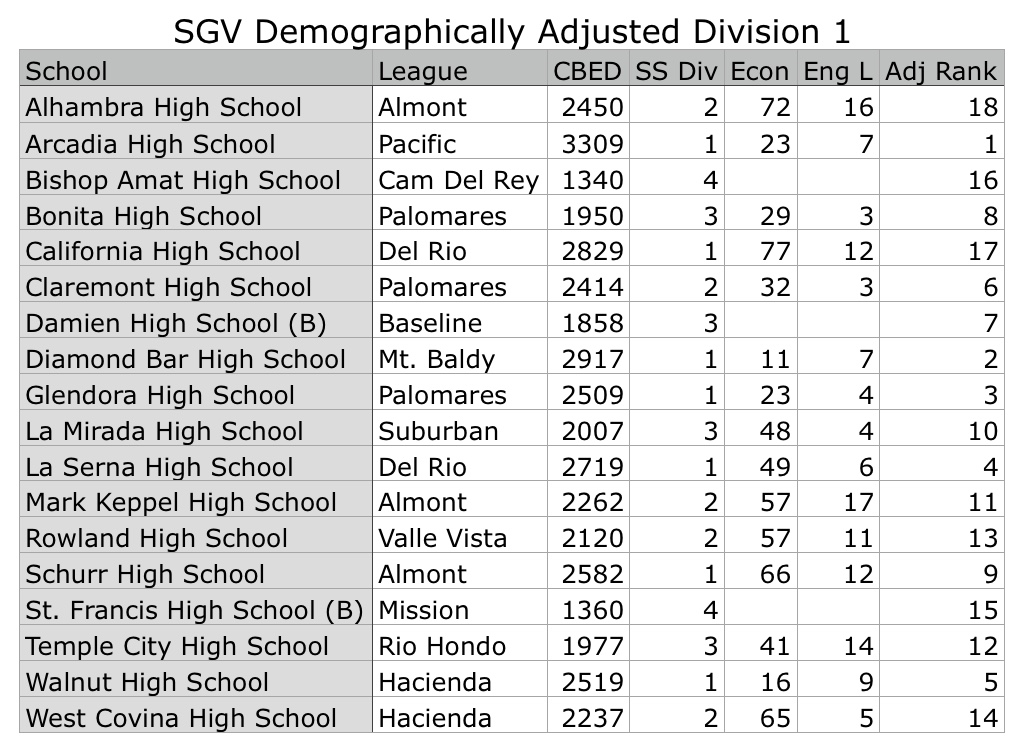
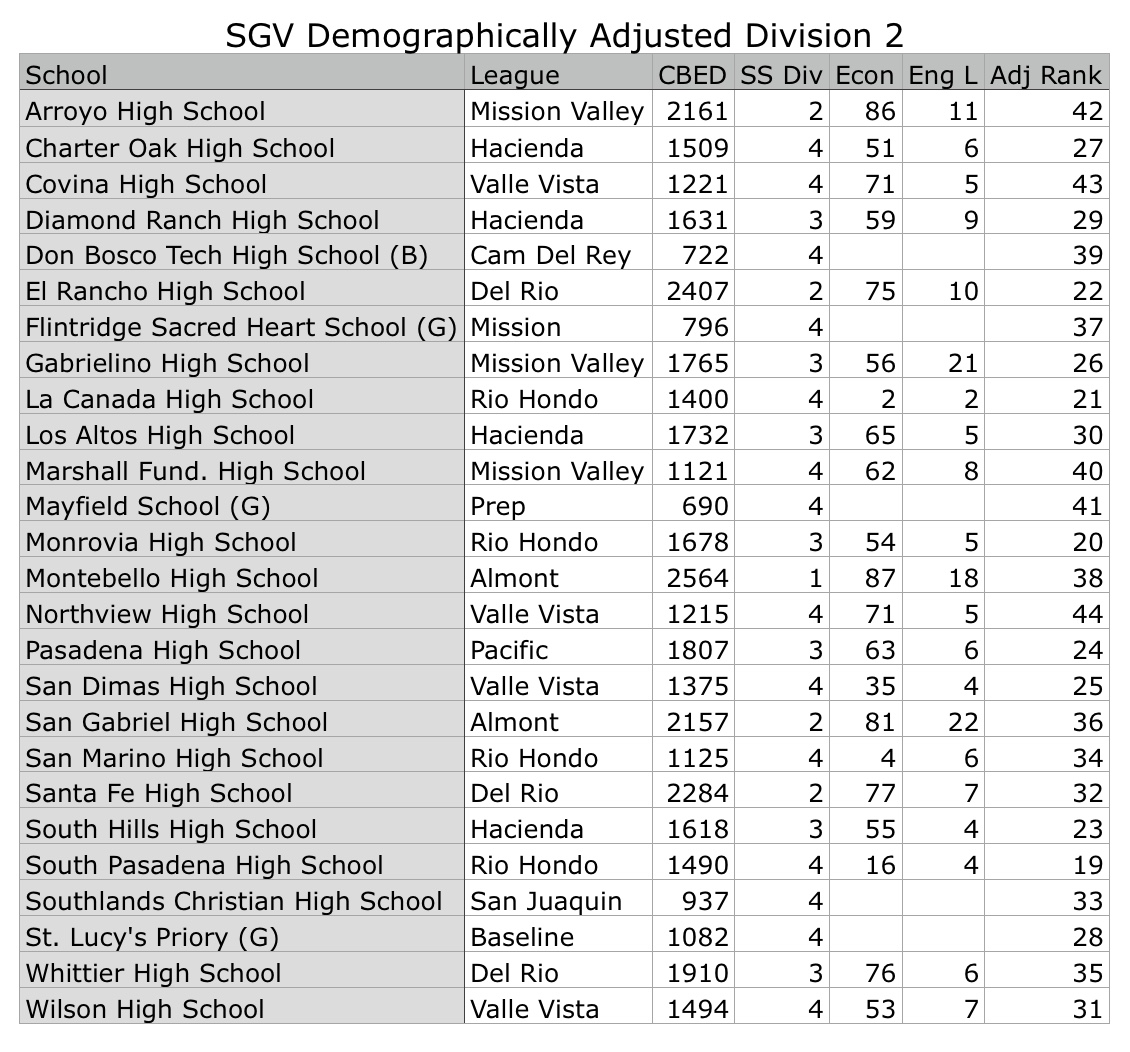
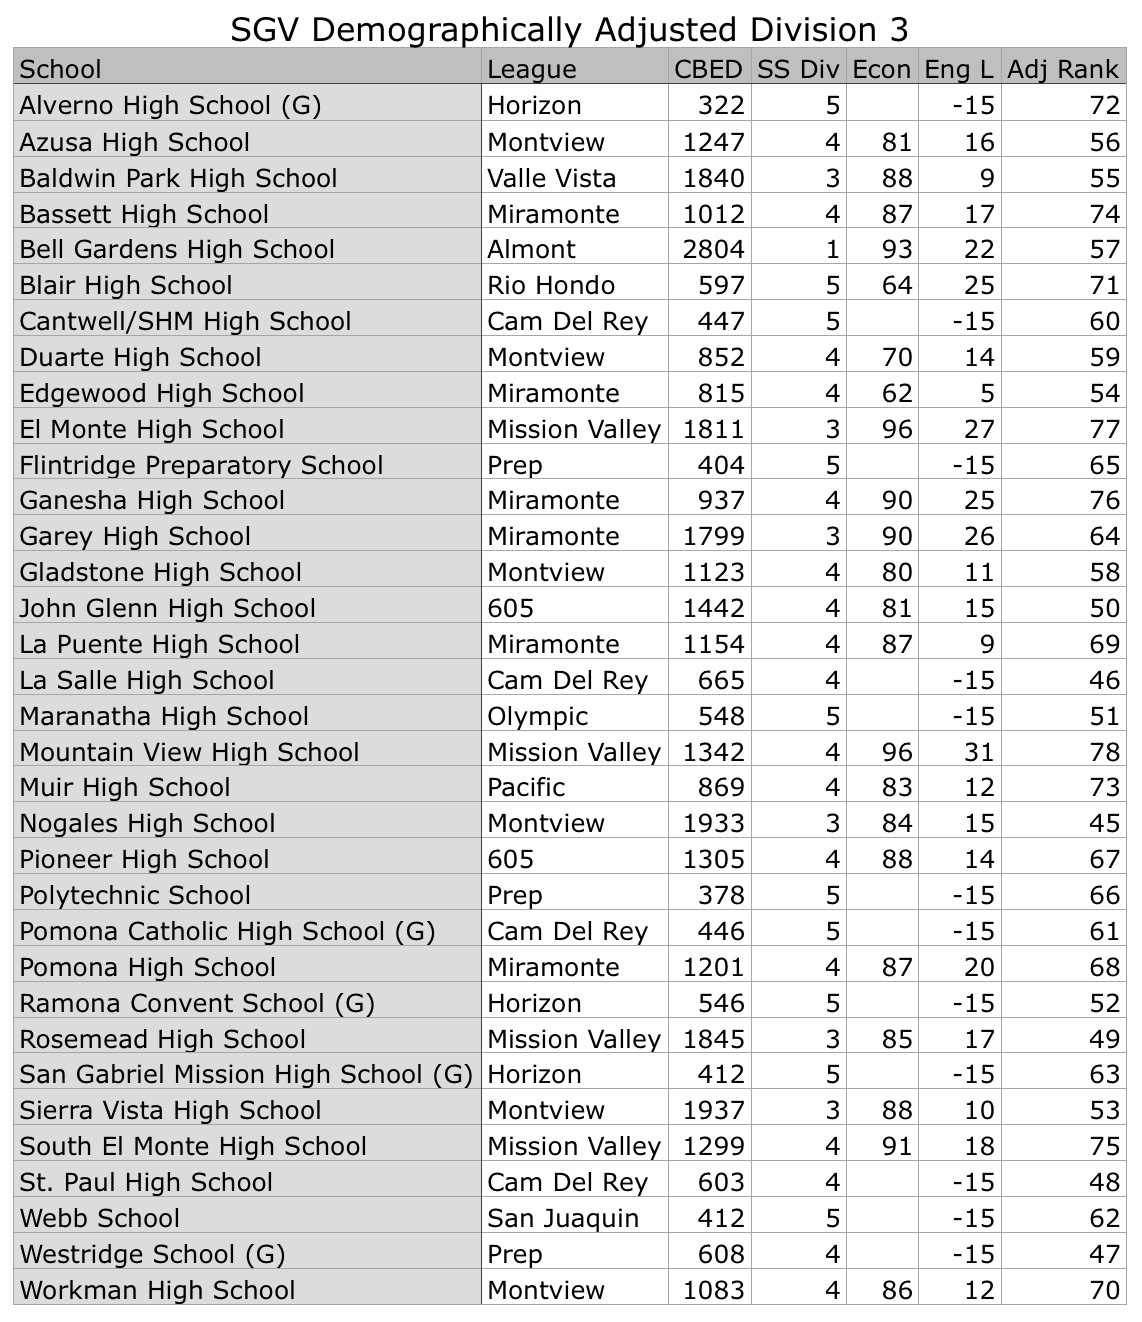
Here are the new XC divisions, along with each school’s enrollment (CBEB) and % of students who are eligible for Free/Reduced Lunch (Econ) and the % of English Language Learners (Eng L) and the school’s new, adjusted size rank among SGV schools.
-Â Bob Ramsey
Want to read even more about the how and why of these rankings?Â
In the CIF Southern Section, schools are divided into five divisions for cross country and four for track and field. They are divided solely on the basis of school enrollment.
While this provides a kind of rough equity between schools, it fails to account for the vast demographic difference between schools of similar sizes. The two extremes in the SGV are La Cañada and Mountain View in El Monte. The schools’ enrollments are only a few dozen apart, and so both compete in CIF Div. 4 for cross country.
But if one compares two readily available stats for California schools, the percentage of English Language Learners and the percentage of students from Economically Disadvantaged families, the two schools are very different.
At Mountain View, 96% of the students are Economically Disadvantaged, and 31% of the students are English Language Learners. Conversely, only 2% of the students at La Canada are ED and only 2% are EL.
The assumption behind these rankings is that as these two factors rise at a school, and especially so at the higher end, these schools become effectively smaller, especially for athletics.
It’s also clear that private schools face a different set of circumstances that can often (always?) make them effectively larger than their enrollment for athletic purposes.
So here is what we (we meaning my son who is trained in economics and stats and I) did…
- CBED: Enrollment numbers used by CIF
- ENG L: % of students classified as English Language Learners
- ECON: % of students classified as Economically Disadvantaged, i.e. qualifying for free or reduced lunch
These rankings were compiled by adjusting each public school enrollment. First students classified as English Language Learners were deducted from the total to give us an adjusted enrollment [CBED – ENG L]. Then the number of students qualifying for free or reduced school lunch less English Language Learners were calculated as a percentage of the adjusted enrollment [(ECON - ENG L)/(CBED – ENG L)]. That percentage squared of those qualifying students were deducted from the adjusted enrollment to give us our final total [CBED – ENG L – (ECON – ENG L)*((ECON – ENG L)/(CBED – ENG L))^2] . Private school enrollment were increased by 15%. Schools were ranked by this final total to generate the rankings.
This is a work in progress. We know the bump given to private schools is arbitrary and doesn’t fit the particular schools equally well. And we realize that using a square of the demographic factors does help account for the expanding impact of those factors as they rise, but it probably over-accounts for those factors at the highest end.
Any suggestions or observations you have to make this system better are welcome – bramseyjr@gmail.com
Leave a Reply